Coming Soon: A Clear Monthly Picture of How Your Business Is Doing
A simple, visual monthly report that shows you what's really happening in your business — beyond the numbers on a spreadsheet.
The Idea?
Your monthly bookkeeping tells you what happened. This takes it a step further.
Starting soon, I'll offer an optional add-on for bookkeeping clients: a Monthly Business Health Dashboard — a one-page visual report, delivered every month, that shows your revenue trends, spending patterns, and cash position at a glance. No digging through reports. No spreadsheets to interpret. Just a clear snapshot you can actually use to make decisions.
What It Will Show You
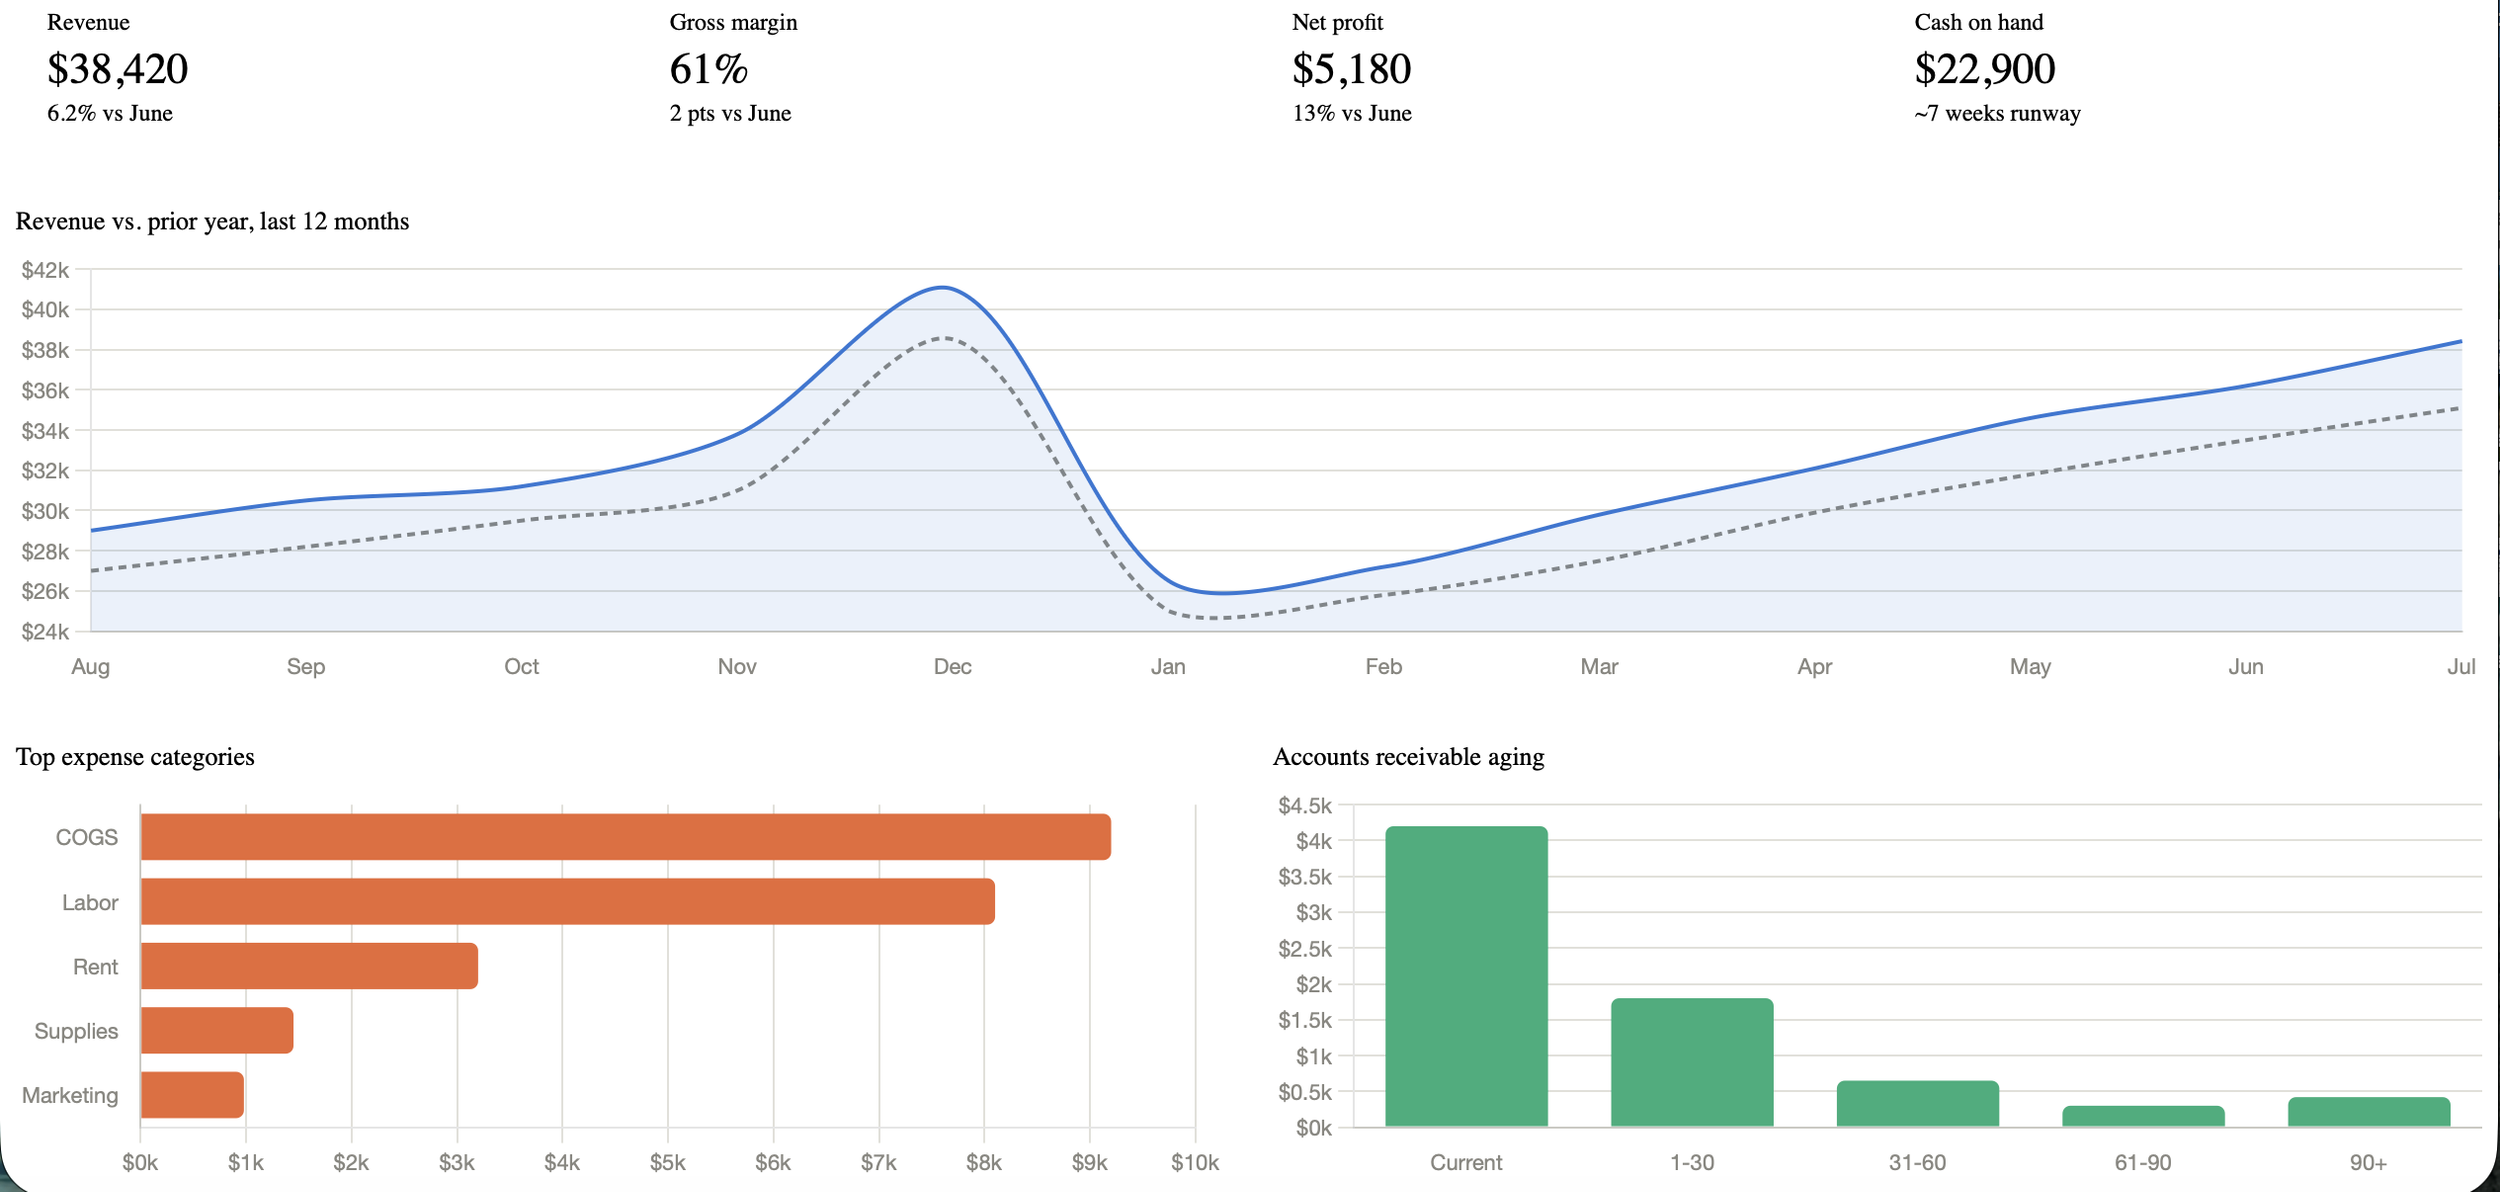
Caption: Example only — actual dashboards are built around your business's real numbers.
Revenue trends — not just this month's number, but how you're tracking against last month and last year
Profit margin — is your margin holding steady, growing, or slipping — and by how much
Net profit — what you actually kept, month over month
Cash on hand — your current cash position, plus a rough runway estimate
Where your money is going — your top expense categories, ranked, so you know exactly what's driving your costs
Outstanding receivables — a breakdown of what's owed to you and how overdue it is, so nothing slips through the cracks
Why Analysis?
Most bookkeepers hand you raw reports and leave the interpretation to you. This dashboard is built to answer the question business owners actually ask: "How am I really doing?" — in a format you can glance at in under a minute, or dig into when something looks off.
It's built using the same data already in your books, so there's nothing extra for you to track or send — it just turns your numbers into something you can act on.
Alongside bookkeeping, I have a background in computer science and data analytics — so building clean, useful reporting tools is something I genuinely enjoy, not just a feature I'm bolting on. This dashboard is a chance to put that to use directly for clients, rather than numbers just sitting in a file.